NOVA — the platform EMA — the AI agent EM Pymes ↗ Solutions Solar self-generation Submetering · Omni-Energy Action EV ↗ The 5 savings fronts Clients and testimonials Resources Contact Log in to the platform ↗
Request a free assessment
35,000 comparable sites · 5 million bills · 13 countries

Do you review your bills —
or just pay them? Between 15% and 30% of what you pay for power, water and gas is invisible overcharge. It stays invisible because there is nothing to compare it against — we compare every site against 35,000.

Risk-free pilot: if the savings don't beat our fee, you don't pay.

Bill · Site 0417 · Electricity EMA auditing
Your team sees Amount due: $ 25,575,900 ✓ Paid without review
We see 5 fronts, automatic
01 Consumption savings 25% above comparable sites $ 00,0%
02 Power factor penalties Power factor at 0.87 and climbing $ 00,0%
03 Rate savings A cheaper rate schedule exists $ 00,0%
04 Claims against the utility Backdated charges and averaged billing $ 00,0%
05 Taxes and other charges Contribution exemption not applied $ 00,0%
Bonus · Administrative savings Bill capture, accounting archive and due-date alerts 0 h
Savings potential identified · 0,0% of this bill $ 0 Person-hours freed per month 0 in a 500-site operation

What sector does your company operate in?

We adapt the cases, the clients and the assessment to your sector.

The efficiency elite

They already made
la the smart decision.

Retail, food, banking, offices, healthcare and utilities. Each one arrived with the same question: how much of this bill is unnecessary. None of them could answer it alone, because nobody has anything to compare against inside their own company.

AB InBev Alsea Domino's Pizza McDonald's Burger King Banco de Bogota Grupo Aval Mercado Libre Olimpica Colanta Falabella Backus Dollarcity Jamar Leonisa Marcimex

Your finance blind spot

Four questions almost
no company can answer.

It isn't carelessness. Reviewing hundreds of bills a month by hand is impossible — and what cannot be reviewed gets paid exactly as it arrives. And even if you do review it: reviewing your bill tells you whether it adds up; comparing it tells you whether it was billed correctly.

01

Who approves your utility bills today?

Probably accounts payable. They arrive, they get booked, they get paid. The process works perfectly — for the utility.


02

What are they compared against before they're paid?

Against the contract? Against history? Against the twin site? If the answer is "against nothing", every error gets paid in full — and charged again the following month.

03

Which of your sites pays twice what its twin does?

Same format, same floor area, same hours. It happens in every multi-site network. The question is which one — and today you have no way of knowing.

04

And if nothing changes?

This month's overspend becomes next year's baseline budget. And when IFRS S2 demands audited energy data, the report you assemble in Excel today becomes your most expensive problem.

It is not your company. It is the pattern.

0%of utility spend is avoidable with active management
0%of manually reviewed bills go through with undetected errors
0%of the energy generated worldwide is lost before final use
0%of consumption in retail and food service sits in HVAC and refrigeration

Energy Intelligence

What if power, water and gas stopped being an opaque cost
and became something you manage?

That is exactly what Energy Intelligence does: it turns every bill — any of the three services — every meter and every site into decisions, in real time and at multi-country scale. NOVA is where it lives.

Energy Intelligence capability · Platform

NOVA

It captures the bill from the utility or the PDF, normalises it and audits it line by line against your history, your contract and your comparable sites.
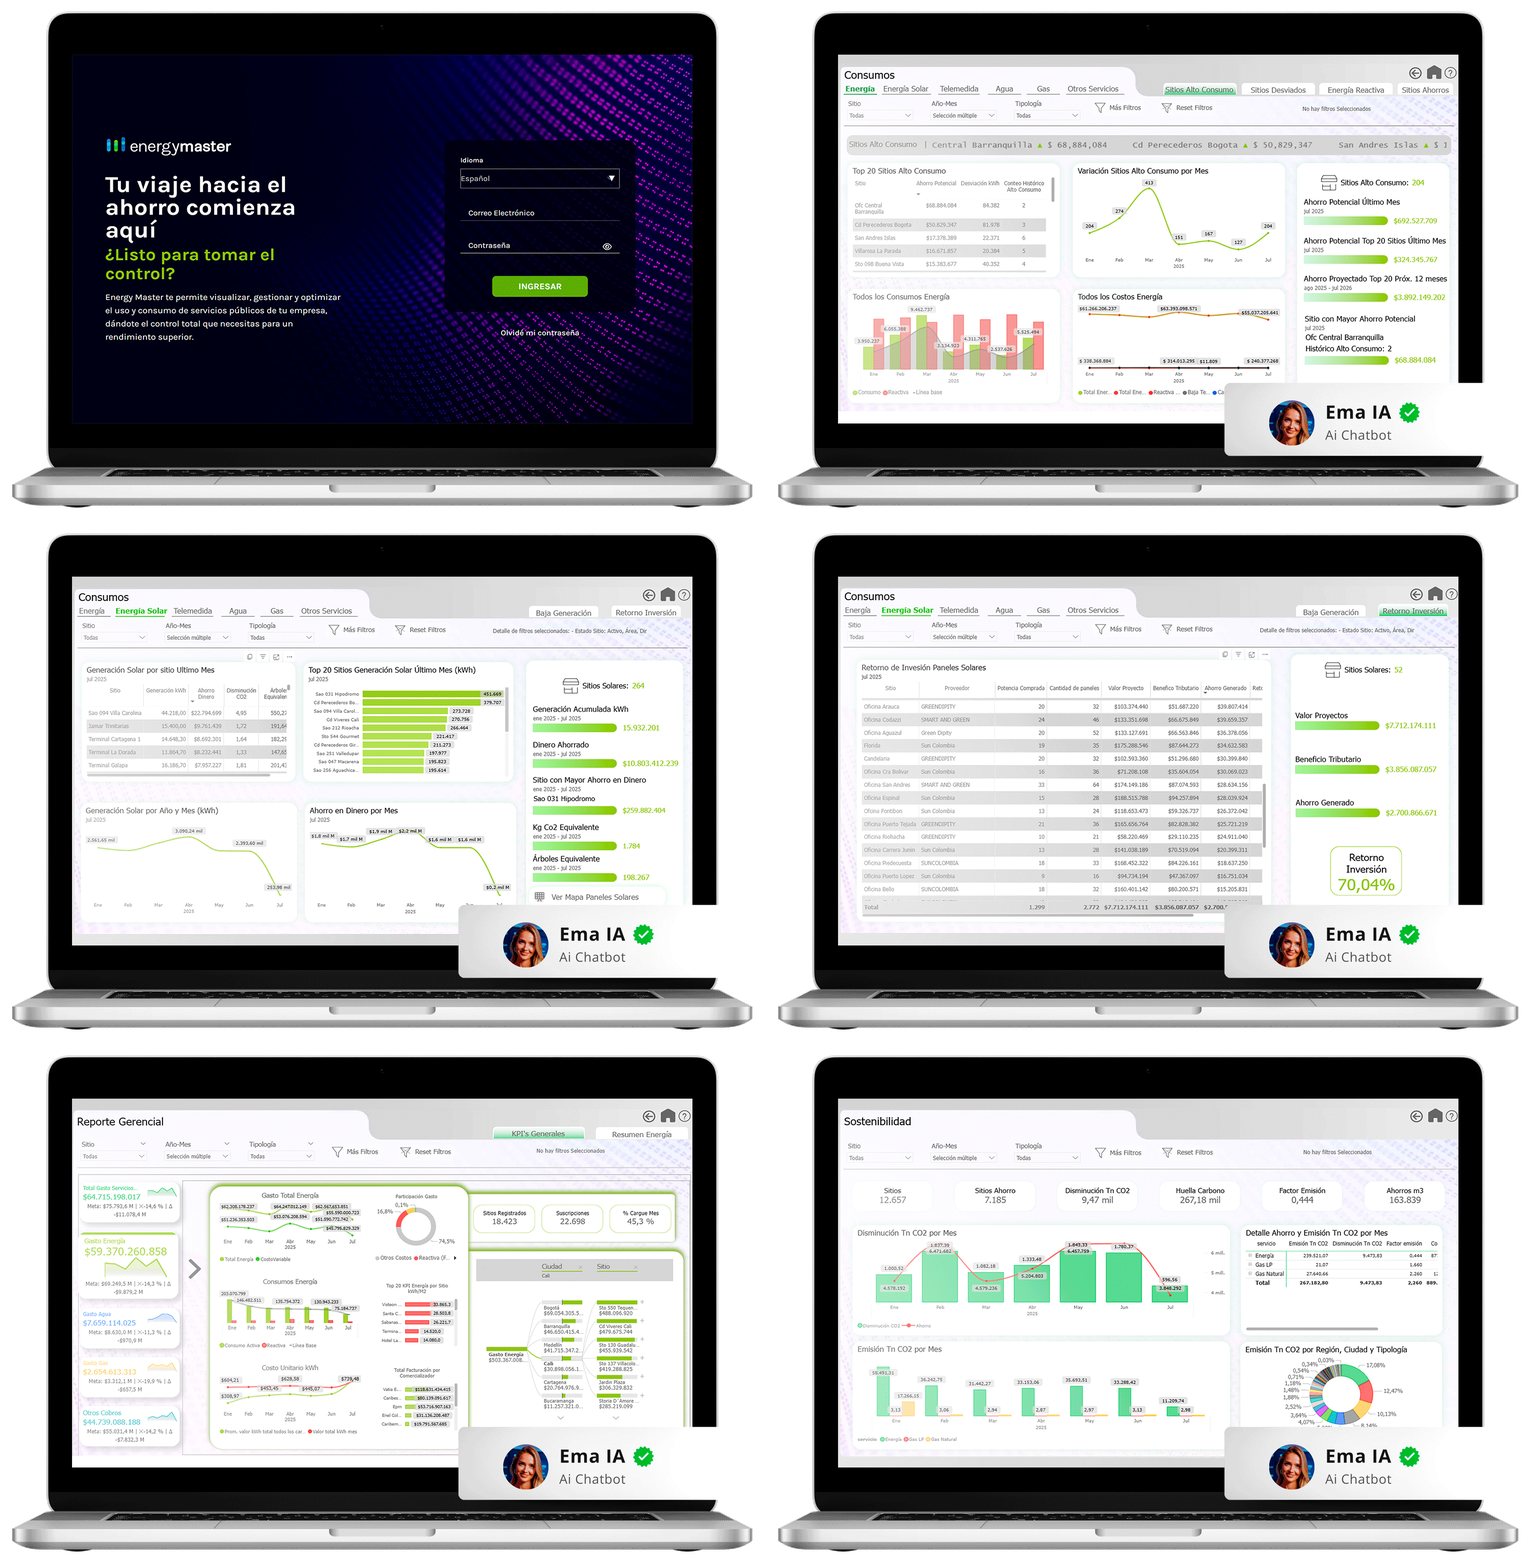
  • Compared against 35,000 sites. Yours, against the ones that resemble it inside and outside your company.
  • Line-by-line audit. Power, water and gas. Every deviation priced in money.
  • Alerts before charges land. Due dates, unusual consumption and tariff changes.
  • KPIs and management reports built for you. The ones your committee asks for, not the ones the tool ships with.
  • Exportable ESG reports. Traceable back to the source bill.
  • Budget by site. Execution tracking and spend forecasting.
  • Integration with your ERP. SAP among others, so the data lands where your team already works.
Plataforma NOVA con el asistente virtual EMA en funcionamiento

EMA · Energy intelligence agent

What if your best energy analyst
never slept?

It doesn't wait to be asked. EMA — Energy Master Analytics — detects, warns and acts before the problem reaches you on the bill. She is not just any AI: she is trained on the knowledge of our own specialists and on nine years of real LatAm data. She is a digital employee who lives your day to day, and you have her on the web, on WhatsApp and inside NOVA, 24/7.

9:41
Envigado-bill-august.pdf · 3 pagesSending you the bill for the Envigado site. The manager says it went up and we do not know why.09:12 ✓✓
Read it and cross-checked it against the last 6 months. Three findings at site 0417:

🔴 Service voltage level misassigned — you're billed at level 1 and your service is level 2. $935 recoverable.
🟠 Power factor penalised — power factor at 0.86. $310/month.
🟠 Averaged billing 3 months running, with no actual reading. 09:13
Voice note · 0:09How much of that can be recovered retroactively?09:14 ✓✓
She replies in audio · 0:14Five years of misbilled service voltage are claimable: ≈ $10 K. Power factor penalties are not recovered — they are eliminated going forward.

Sending you the full report with the bill-by-bill backup 📎
View reportFile the claim
09:14
⚠️ HVAC at 14 stores started at 5:40 a.m. They open at 9:00.

That's 3h 20min of HVAC with the store empty, every day. Estimated cost: $2,100/month across the network.06:02
Shall we move it to 8:00?08:15 ✓✓
With the thermal inertia of those units, starting at 8:15 reaches 24 °C before opening. Savings: $1,725/month.

Separately, eight stores have the setpoint at 21 °C. Raising it to 24 °C cuts equipment consumption by 15% and 21% without affecting comfort.08:16
Apply both changes.08:17 ✓✓
✅ Schedule sent to the BMS at all 14 stores. Setpoint 24 °C, start-up 8:15.

I'll confirm the actual savings against baseline at month-end.
View scheduleNotify operations
08:17
EMA is typing…

Proactive, not reactive

It monitors non-stop and warns when something drifts out of range. Before the bill arrives, not after.

Speak to her and she speaks back

A natural voice, like a real person. And she answers in whichever language you speak to her: Spanish, English or Portuguese.

Send her the bill

If you are not a client yet, upload it and watch the analysis live, right now. If you already are, you do not have to send anything: your account manager connects it to your provider and EMA loads it on her own, every month.

Ask her what you would ask a person

Send her an email, ask her for a report, tell her to warn you if something happens, ask her about a change in regulation or ask her for advice on cutting consumption.

30-day pilot

Before we explain the five fronts,
let us show them to you on your own bills.

Thirty days on your real bills, with no CAPEX and no extra hardware. If the savings identified do not beat our fee, you do not pay — and you keep the assessment.

From 50 sites 30 days No cost · no CAPEX

The five fronts

Savings don't come from a trick.
They come from five fronts worked at the same time.

Each front attacks a different source of overspend. We work them in parallel, site by site, and report each one separately so you know exactly where every peso came from.

We identify avoidable consumption by comparing each site against itself over time and against twin sites of the same format. We spot deviations, equipment running outside hours, and load curves that do not match the operation, then prioritise the fixes by return.

Deviation detectionSite-to-site benchmarkBaseline per siteRemote meteringHVAC and refrigeration efficiency

The reactive power multiplier grows month after month if nobody intervenes, and very few finance teams know that line item exists. We correct it with active filters and capacitor banks, tuning first the compensation equipment you already own: in most cases there is no need to buy new hardware.

5–20% savings on power factorPower factorActive filters and banksNo CAPEX in most cases

We negotiate the price of energy with the volume of your entire network — regulated and unregulated, including switching provider — we verify that the assigned voltage level and tariff option are the correct ones, and we maximise with AI the performance of the solar assets you already have. When the roof is not enough to generate, we evaluate remote generation and energy communities.

5–20% savings on ratesRegulated and unregulated marketSwitching providerEnergy communitiesSolar asset performance

We recover money that already left your budget. We file directly with the operator: estimated billing with no real reading, the wrong tariff applied, double charges, unjustified retroactive charges and late-payment interest that never applied. We follow the case through to the adjustment, without your team having to open a single claim.

Direct filingRetroactive recoveryFollowed through to the adjustment

We identify the tax incentives for energy efficiency and renewable adoption that apply to your operation, under Law 1715 in Colombia and its equivalents across LatAm. And we audit the regulatory charges on the bill — contributions, waste levy, public lighting, security levy and VAT in the markets where it applies — which are overpaid far more often than anyone imagines.

Law 1715 and LatAm incentivesWaste, lighting and security leviesContributions and VATCertificates and filings
Included in every plan

Bonus: administrative efficiency

One platform for every site. Due-date alerts before anything falls overdue, budget by site with execution tracking, and downloadable reports for the close and the board pack. Manual work for the admin team drops by up to 80%. And your team is not left alone: regular energy tips and efficiency training so the saving holds.

80%less manual work

How we work

The intelligent efficiency cycle

01

Capture

We capture bills and consumption automatically, from the provider or from the PDF.

02

Analytics

The AI audits, normalises and compares. The data lands ready in dashboards by site and by region.

03

Execution

We prioritise and run savings initiatives site by site across the five fronts.

04

Tracking

We measure each initiative against the baseline and deliver the KPIs.

05

Results

The savings hold because the cycle never stops: every month it starts again.

Where the judgement comes from

We did not only learn about energy.
We learned to compare.

That is why the same method found savings in water and in gas, and worked the same across thirteen countries with more than 50 different providers and regulators. These are the eight sources we cross-reference to know, site by site, what is normal and what is not.

The hub

NOVA cross-references all eight.
EMA tells you about it.

Utility bills

Electricity, water and gas

Site metadata

Hours, floor area and rate

Energy market

Market, regulation and tariffs

Weather and temperature

Anomaly vs. season

Benchmark

35,000+ sites in LatAm

Submetering

By area, circuit or equipment

Self-generation

Distributed generation

Solar inverters

Generation telemetry

There are three ways to connect a site, and each one sees more than the last: the bill, monthly and aggregated; the meter, hour by hour; the device, in real time and load by load. Crossing those doors with five million bills already read is what makes the invisible visible: NOVA tells you why a site went up and EMA warns you before the bill arrives.

Multi-country operation

Every country sends you its bill.
Nobody sends you the comparison.

If you operate in several countries, your energy spend lives in as many formats as you have utilities: different currencies, different regulators, line items that are not called the same thing. Consolidating it is manual work someone does every month and nobody audits.

01

The information is not centralised

Each country reports in its own format, currency and calendar. The regional consolidation is assembled by hand, arrives late, and by the time it is ready it has changed.

02

There is no traceability

When someone asks where a figure came from, the answer sits in one person's inbox or in a spreadsheet version nobody can find any more.

03

The sustainability report is close to impossible

Not for lack of will: because the data does not exist at the level of detail the report demands. And an estimate does not survive an audit.

04

You cannot compare equivalent sites across countries

Is your Guadalajara store more efficient than its twin in Bogotá? Without a shared energy productivity metric, that question has no answer — and it is exactly the one that reveals where the savings are.

We measure with the same energy productivity metric across the 13 countries where client sites are, run from our central operation in Colombia. A local competitor can audit your bills just as well in their own country. What they cannot do is tell you which of your sites, in which of your countries, pays more than its equivalent — because for that you have to be in all of them.

Savings assessment

Nobody can tell you how much you are losing without knowing your operation.
That is why we start by asking.

Four questions, 60 seconds. The estimate comes from comparable operations in your sector — and the definitive number comes from the pilot on your real bills.

Step 1 of 4 · Size of the operation

How many sites or service points do you manage?

Count stores, offices, plants, warehouses and any point with its own meter.

1 to 49 sites

For your scale we have something better — and it is free to start.

EM Pymes is the same audit engine, self-service: you upload your bills, EMA reviews them over WhatsApp and tells you what to dispute. No implementation project, no upfront cost.

Go to EM Pymes ↗

Roughly how much do you pay in utilities each month?

Electricity, water, gas and waste collection combined, across the whole operation. An estimate is fine.

What sector does your company operate in?

This sets the typical savings range and which fronts we tackle first.

What is your role when it comes to this spend?

This adjusts what we show you first: cash, operations or ESG reporting.

Estimated annual savings
This range gets paid every month, managed or not. The only difference is who you pay it to: the utility, or your own P&L.

Worth confirming it against your real bills? That is all the assessment answers.

Get the full assessment

We send you the breakdown by savings front and book 30 minutes with a specialist in your sector.

Cumulative results

Nine years comparing.
This is what came out of it.

Everything below is savings verified against baseline and reported to the client. No projections.

+$0 MUSD in verified savings for our clients
+0 KMWh of energy saved
+0 Ktonnes of CO₂ that were never emitted
+0 Mlitres of water saved
<0%annual churn: clients stay
0%NRR — every account grows year on year
6.8×

Pilot across 200 convenience stores: return verified before scaling to the rest of the network.

Real testimonials, in their own voice.

We manage the utilities — power, water, gas and other charges — of the largest multi-site operations in Latin America

AB InBev
Starbucks
Alsea
Domino's Pizza
McDonald's
Burger King
Mercado Libre
Falabella
Tiendas D1
Grupo Aval
Banco de Bogota
Banco de Occidente
Banco Popular
Banco AV Villas
Banco Caja Social
Porvenir
Allianz
Olimpica

Colanta

WOM
TCC
Totto
Tostao Cafe y Pan
Vips
Backus
Bafar
Dollarcity
Leonisa
Jamar
Isimo
Marcimex
Mas x Menos
Megasuper
Gases de Occidente
Chili's
P.F. Chang's
The Cheesecake Factory
Archies
Parmessano
Home Burgers y Shakes
Clap Burgers
Modelorama
Grupo Recordar
Todo Fresa
Percimon
Olivia
SIES Salud
Distracom
Comfandi
Novotechno
Calzado Bucaramanga
MediArte
AVC Aval Valor Compartido
Teleperformance
Universidad EAFIT
BioCity
Habitat Horizontal

and more than 35,000 sites managed across 13 countries in the Americas, Europe and Asia. We are not plugged in from the outside like one more vendor: we are integrated at the system level, as a strategic partner — and we have been there for nine years.

Proof of concept

The evidence answers
better than we do.

From 50 sites 30 days Electricity + water + gas No cost · no CAPEX No extra hardware

Nine years of doing this taught us not to promise results: we verify them. 30 days, your real bills, a number your own finance team can audit. If the savings identified do not beat our fee, you do not pay — and you keep the assessment. Charging on savings is a good way to start and a bad way to stay: we begin where others stop.

Book my free assessment
Days 1–7Bill uploadWe connect to your utility or upload the PDFs from recent months.
Days 8–205-front assessmentLine-by-line audit, including taxes and regulatory charges.
Days 16–25Live dashboardNOVA in production with your sites, and the first alerts from EMA.
Day 30Report and action planSavings identified by front, with the bill-by-bill backup.

FAQ

What they ask
before saying yes.

Reviewing a bill tells you whether it adds up. Comparing it tells you whether it was billed correctly — and for that you need something to compare against. Inside your company you can only compare yourself to yourself, and if the overcharge has been there for years, last month was not the right number either. We compare every site against 35,000 sites from similar operations, across thirteen countries and more than 50 different providers and regulators.
It does part of it, and what it lacks is not product: it is position. It only sees its own — it compares consumption and tariffs of the sites that are with that provider, and if your network has sites with three different providers, each platform sees its slice and none sees the whole. It does not know what your site is like — it has your consumption, but not the opening hours, the floor area, the format, the climate or the equipment; without that metadata it can tell you that you consumed more than last month, not whether that is right or wrong. And it compares against its own portfolio, not against the market: we contrast every site against 35,000 sites from thirteen countries and more than 50 providers, including equivalent sites that are with someone else. There are also two things its platform simply cannot do: we load the remote metering of a site that is with your provider and read it hour by hour to compare it against similar sites that are not in its portfolio; and we load water and gas, which an energy provider does not bill and therefore cannot see — and that is usually exactly where the error has gone uncorrected the longest. One last one, and it is not a reproach: the provider is your counterparty on that bill. Its platform is not built to tell you that one of its own charges was wrong, or to recommend that you negotiate with someone else.
No. Nobody sees your bills or your consumption, not even aggregated under your name. What feeds the comparison are statistical ranges by typology — site format, floor area, opening hours, climate, country and tariff structure — built on nine years and five million bills. Your operation is contrasted against that pattern, and the pattern cannot be reverse-engineered back to anyone. The same applies the other way round: you do not see anyone else's data either.
All three, plus other charges that arrive on the same bill: public lighting, waste levy, security levy and contributions. The method is not about energy, it is about comparison — which is why it works just as well on water and on gas, where on top of that almost nobody is looking and errors go uncorrected for longer.
No. There are three ways to connect a site and each one sees more than the last: the bill — monthly, and it requires nothing — the meter and the device. You always start with the bill. Submetering and real-time telemetry are optional and get decided after the assessment, once you know which sites justify them.
The assessment is live in 30 days. Full implementation takes 60 to 90 days for operations of 500 sites or more. During that time your team does not change its process: we connect to what already exists.
It has not happened in nine years of operation. If it did, there is no commitment of any kind: the proof of concept is free and carries no lock-in clause — and you keep the assessment. That said, the easy saving runs out in every operation, yours included. What does not run out is having something to compare against: that is what sustains the relationship once the first curve has been harvested.
Infrastructure runs 100% on Microsoft Azure, with ISO 9001 certification and compliance with Colombia data protection Law 1581. We are an ISV with Co-sell status on Azure Marketplace. Technical security documentation is shared under a confidentiality agreement.
We have offices and our central operation in Colombia, plus commercial offices in Mexico, and today we manage client sites in thirteen countries across the Americas, Europe and Asia. If yours is not on the form list, that is not a problem: our method does not depend on the country, it depends on being able to compare. The regulator changes, the provider changes and the names of the line items change, but the pattern of overcharge is the same everywhere. All we need to start a pilot in a new market is access to your billing data — that is exactly how we entered most of the countries we are in today: a client took us there.
Three things. We identify tax incentives for energy efficiency and renewable adoption (Law 1715 in Colombia and its equivalents across LatAm). We audit contributions, the waste levy, public lighting, the security levy and VAT in the markets where it applies, all of which are overpaid far more often than anyone imagines. And we handle the certificates and paperwork with the authorities.
We do not sell panels. We do the technical survey of your real need, connect you with allied wholesale distributors to buy equipment at a better price than contracting an EPC directly, help you choose the installer from a directory of more than 760 certified ones, compare EPC and PPA scenarios, support the implementation, and then monitor generation with AI. See the full solution.
A chatbot waits for you to ask. EMA is a digital employee: she monitors without pause and warns you first — when a site drifts out of range, when the air conditioning starts before the operation does, when a bill comes in on an estimate — and on top of that you ask her for things the way you would ask someone on the team. Send her an email, ask her for a report, tell her to warn you if something specific happens, ask her about a change in regulation or ask her for efficiency advice. You speak to her and she speaks back, in a natural voice, in Spanish, English or Portuguese. She is not trained on the internet: she is trained on the knowledge of our own specialists and nine years of real LatAm data. You have her on the web, on WhatsApp and inside NOVA, with no licences and no training.
Yes, through another door: EM Pymes. It is the same audit engine in self-service form, with a free plan to start the same day and a Premium plan when you need more sites and deeper financial control. When the operation grows, migrating to Enterprise keeps your history.

Certifications and recognition

Sistema de gestión certificado ISO 9001 por Icontec e IQNet SC-CER820754 Microsoft Co-Sell Ready Partner Microsoft Co-Sell Ready Partner Top 1 Open Scaleup y Top 1 Energytech · Ranking 100 Open Startups Colombia 2025 30 Promesas de los Negocios 2022 · Forbes ANDI del Futuro We Support · UN Global Compact

The decision

Two options remain
on the table.

Keep paying the bills as they arrive — which is free until you add up what it costs. Or let 30 days of evidence answer for us.
Would you rather know, or keep paying it without knowing?

Confidential · No spam · Reply within 24 business hours  ·  Or message EMA directly: +57 320 567 4137  ·  Another question? Write to us

Risk-free pilot. We work on your real bills, not on a sales estimate.